Core Concepts
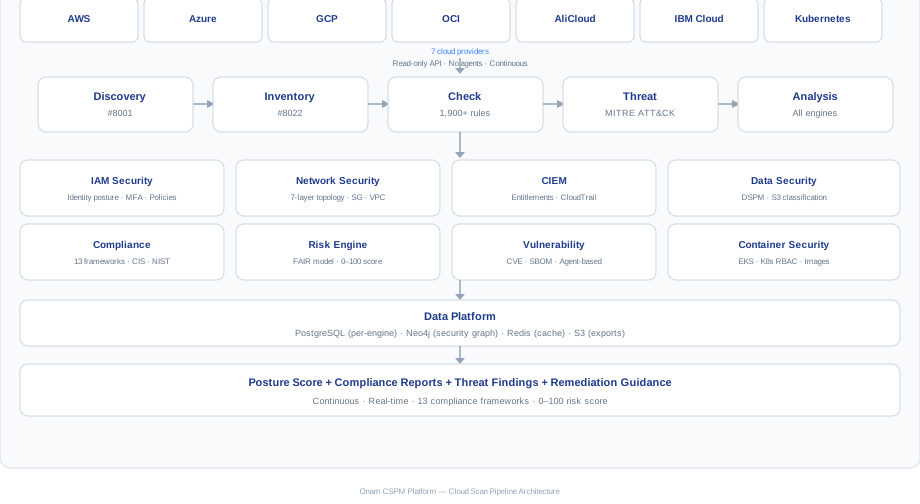
Every screen in the Onam console is built from a small set of ideas: assets connected in a graph, findings raised by engines, scans that refresh both, and three layers of interpretation on top — attack paths, compliance mappings, and dollar-denominated risk. This page gives you that mental model once, so the rest of the docs read as detail rather than mystery.
It ends with a glossary of the terms used everywhere else.
Assets and the security graph
An asset is any resource Onam discovers: an EC2 instance, an IAM role, a storage bucket, a Kubernetes deployment, a self-hosted database. Discovery and Inventory (DI) enumerates assets in multi-phase passes and writes two tables that everything else builds on: asset_inventory (the resources) and asset_relationships (how they connect — this role can assume that role, this instance sits in that subnet, this bucket is readable by that principal).
Those relationships are what make Onam a security graph rather than a resource list. Findings attach to nodes; attack paths are walks across the edges; blast radius is the neighborhood you can reach from a node.
Findings and severities
A finding is one rule failing on one resource: rule, resource, severity, evidence, violated frameworks, and remediation steps, in a consistent shape across all engines (see the Finding Schema). Findings carry one of five severities:
| Severity | Meaning | Expected response |
|---|---|---|
| Critical | Directly exploitable or exposing sensitive data now | Fix within 24–48 hours |
| High | Serious weakness, typically one step from exploitable | Fix within the week |
| Medium | Defense-in-depth gap or policy violation | Schedule into normal work |
| Low | Hardening opportunity | Batch with related changes |
| Info | Observation, no action required | Awareness only |
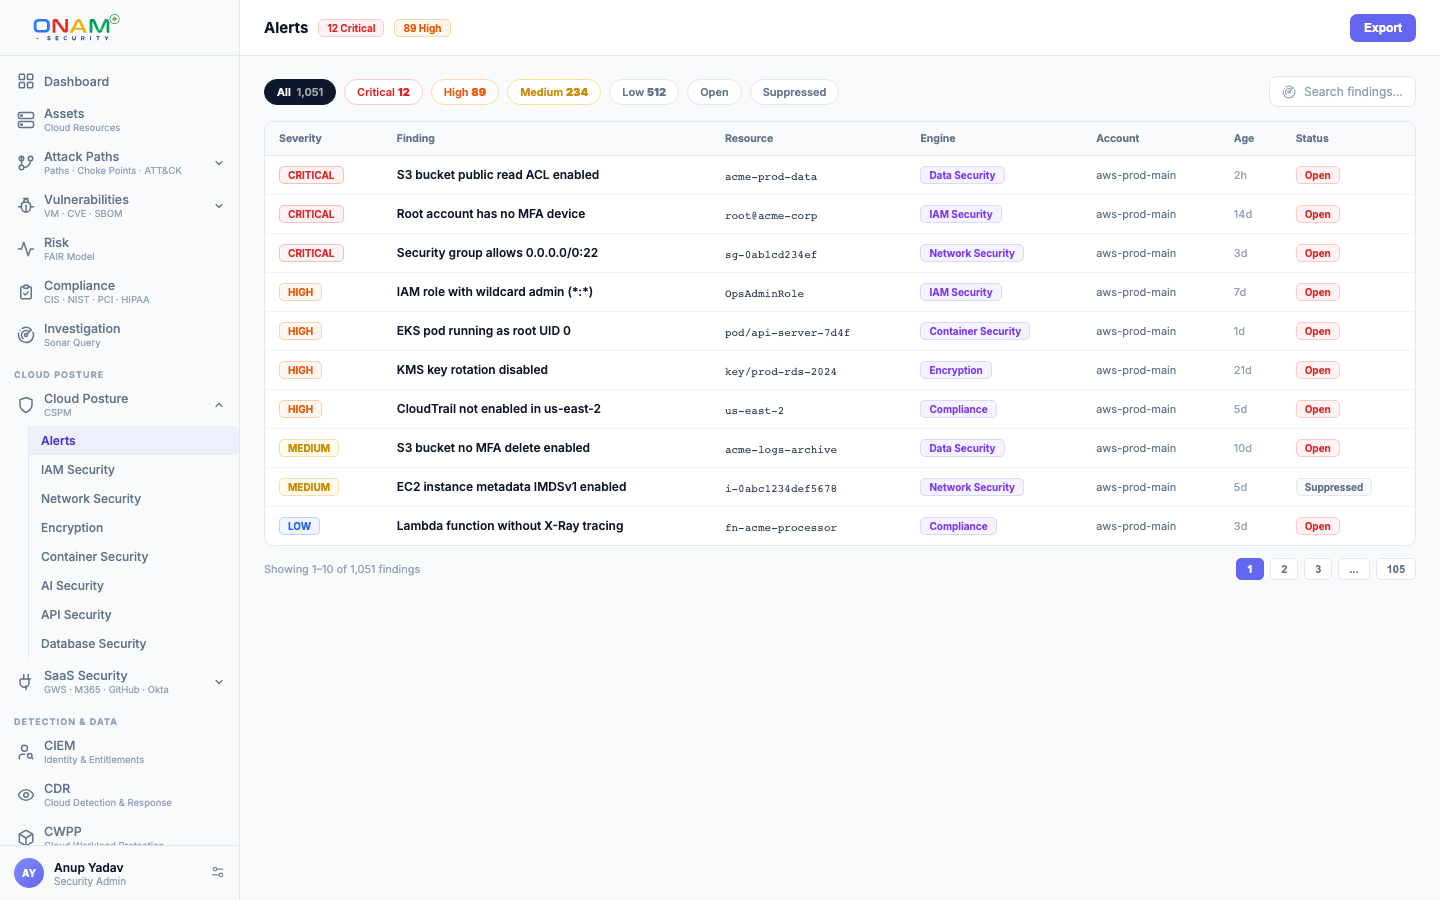
Severity is a property of the rule; priority is a property of the graph. A Medium finding on an attack path to a crown jewel routinely outranks an isolated Critical. Triage from the Attack Paths and Risk views, not from raw severity counts.
Findings you accept as business risk can be suppressed with a justification and optional expiry — they leave the active queue but remain visible and recorded in the compliance evidence trail.
Engines
The platform runs 29 engines; each is a service responsible for one security domain, and each writes findings to the same data model. The ones you will interact with directly:
| Engine | What it evaluates |
|---|---|
| Check (CSPM core) | The 9,853 posture rules against every discovered resource — CSPM |
| IAM / CIEM | Effective permissions, unused access, privilege-escalation chains — CIEM |
| Attack Path v2 | Graph traversal from entry points to crown jewels — Attack Path |
| CDR / Behavioral Analysis | Audit-log threat detection across all 7 providers — CDR |
| Data Security (DSPM) | Data store discovery and PII, PCI, PHI classification — Data Security |
| Vulnerability | CVEs prioritized by EPSS, CISA KEV, and exposure — Vulnerability Management |
| Network Security | 7-layer network posture and effective exposure — Network Security |
| Container Security | EKS, ECS, AKS, GKE posture, images, and K8s RBAC — Container Security |
| Compliance | Mapping findings onto 78 framework control catalogs — Compliance |
| Risk Quantification | FAIR-based dollar exposure — Risk Quantification |
| Code Security | SAST, secret detection, IaC checks, SCA with CycloneDX SBOM, and DAST — Code Security |
| Technology Engine | 34 self-hosted technologies in 9 categories |
Encryption, database security, AI security, API security, agentless workload scanning, and the platform services (rule builder, remediation, the AI assistant) round out the full list in the Architecture Overview.
Scan cycles
- A full scan re-runs the whole pipeline: DI enumeration, rule evaluation, engine fan-out, graph rebuild, compliance and risk. Your first scan is always full, and scheduled scans (daily is typical) keep the baseline fresh.
- An incremental scan re-evaluates what changed since the last run rather than re-enumerating everything, so new misconfigurations surface quickly between full scans.
- Ad-hoc scans can be triggered any time from the Scans page or the API — useful right after a remediation sprint to confirm findings closed.
- CDR is continuous, not cyclical: it ingests audit and activity logs from all seven providers as they arrive, with three detection tiers — single-event rules, multi-event correlation scenarios, and statistical behavior baselines.
Every finding records the scan run that produced it, so you can always answer "as of when?"
Attack paths, choke points, and crown jewels
An attack path is a verified chain of steps from an entry point (an internet-reachable or externally exposed asset) to a crown jewel (a high-value asset — production data stores, admin identities, KMS keys — classified by catalog rules you can tune). Attack Path v2 derives edges from about 25 catalog-driven sources (IAM policy analysis, network exposure, security-group matches, KMS grants, CDR behavior, public exposure) and verifies each edge across five security domains before marking it CONFIRMED. Each hop is annotated with MITRE ATT&CK techniques, and capability accumulates along the path — what the attacker can do grows hop by hop.
A choke point is a node that many paths pass through. The console ranks the top 5 — fixing one choke point severs every path through it, which is why choke points are usually the highest-leverage work on the board.
Compliance mapping
Rules are mapped to the controls they evidence across 78 frameworks — CIS Benchmarks, NIST 800-53, PCI DSS, HIPAA, ISO 27001:2022, SOC 2, GDPR, FedRAMP, and more. One finding can count against controls in several frameworks; fixing it moves all of those scores at once. Per-framework reports show control-by-control pass rates with the underlying findings as evidence. Details in Framework Coverage.
Risk in dollars: FAIR
The Risk Quantification engine implements the FAIR (Factor Analysis of Information Risk) model, running as the final layer after all other engines. It takes Critical and High findings and computes: Risk = Loss Event Frequency × Loss Magnitude, where frequency comes from threat event frequency and vulnerability, and magnitude combines primary and secondary loss.
Every input is visible: default per-record costs by industry (healthcare $10.93, finance $6.08, technology $4.88, retail $3.28, default $4.45) that you can replace with your own figures, regulatory multipliers where the highest applicable one applies (GDPR ×1.5, SOX ×1.4, HIPAA ×1.3, PCI-DSS ×1.2), and data-sensitivity multipliers (restricted ×3.0 down to public ×0.1) that your tenant can override. The output — risk reports, summaries, and trends — is what turns "1,400 findings" into "an estimated $2.3M of exposure, concentrated in these five issues."
Glossary
| Term | Definition |
|---|---|
| Asset | Any discovered resource — instance, role, bucket, cluster, database |
| Asset relationship | A typed edge between assets: assumes, contains, can-read, exposes |
| Security graph | Assets plus relationships plus findings, stored as a traversable graph |
| Finding | One rule failing on one resource, with evidence and remediation |
| Rule | A single check (9,853 posture rules), mapped to framework controls |
| Engine | A service that evaluates one security domain and emits findings |
| Scan run | One execution of the pipeline; every finding references its run |
| Severity | Rule-assigned impact level: Critical, High, Medium, Low, Info |
| Attack path | A verified, CONFIRMED chain from an entry point to a crown jewel |
| Entry point | An asset reachable from outside — the start of a path |
| Crown jewel | A catalog-classified high-value asset — the end of a path |
| Choke point | A node many attack paths share; one fix severs all of them |
| Blast radius | Everything reachable from a given asset if it is compromised |
| Suppression | A justified, optionally expiring acceptance of a finding |
| FAIR | The risk model behind Onam's dollar loss estimate per finding — low, likely and high |
Next steps
- Quickstart — put the model into practice on your first account.
- Architecture Overview — the 29 engines and the pipeline in full detail.
- Attack Path — derivation, verification, and choke-point ranking in depth.
- Risk Quantification — the full FAIR methodology and tenant overrides.