Risk Quantification (FAIR)
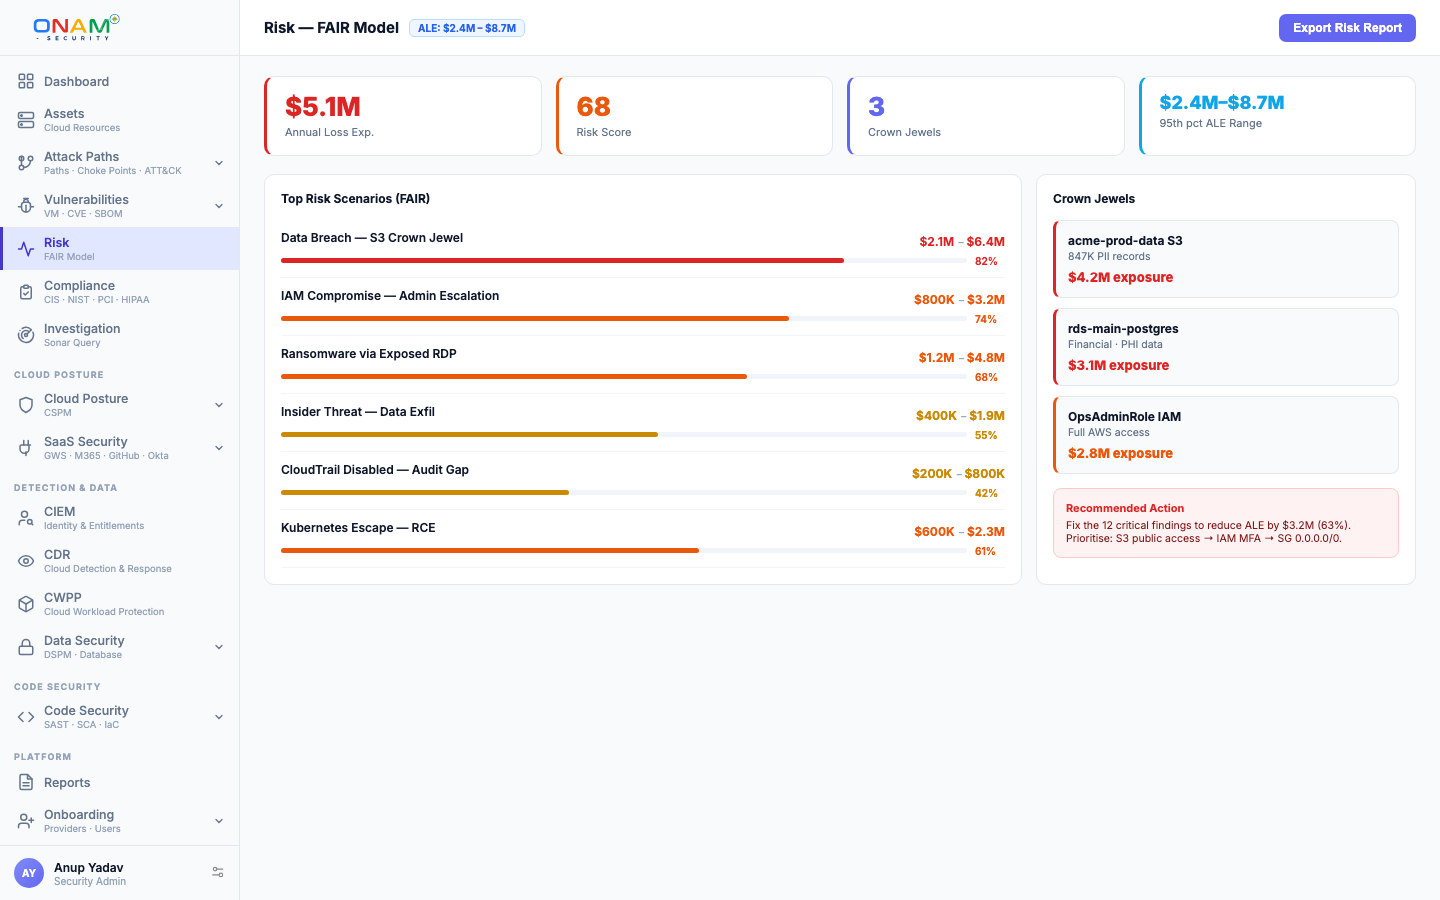
Onam's Risk engine gives critical and high findings a FAIR-style loss estimate in dollars. FAIR (Factor Analysis of Information Risk) breaks risk into how likely a loss event is and how large the loss would be; Onam follows that structure per finding. The output is a business-language view: total exposure, the top scenarios ranked by likely loss, and how exposure is trending.
This page explains the formula, the inputs it uses, how attack-path context raises an estimate, and where the engine runs in the platform pipeline.
The Model
Risk = Loss Event Frequency × Loss Magnitude
Loss Event Frequency = exploit probability (EPSS) × exposure factor
Loss Magnitude = records × per-record cost × sensitivity × asset value × regulation| Factor | Question it answers | Where Onam gets it |
|---|---|---|
| Exploit probability | How likely is this weakness to be exploited? | EPSS scores for the finding |
| Exposure factor | How reachable is the resource? | Public or internal exposure, raised by attack-path signals (below) |
| Records and per-record cost | How much data is at risk, and what does each record cost in a breach? | Record estimates and industry per-record breach-cost benchmarks, overridable per tenant |
| Sensitivity | How sensitive is the data? | The DSPM classification of the affected store — restricted, confidential, internal or public |
| Asset value | How valuable is the resource? | An asset catalog, with crown jewels from the Attack Path engine weighted highest |
| Regulation | Which regulations apply? | The data and the region — GDPR is applied automatically to resources in EU regions |
Where the Engine Runs
Risk Quantification runs after discovery, checks and the domain engines have completed, so it prices the finished picture rather than raw signals:
| Stage | What happens | Output |
|---|---|---|
| 1. ETL | Pulls critical and high findings once the scan completes | Normalized risk input set |
| 2. Evaluate | Applies the computation per finding — likelihood, loss, multipliers, attack-path signals | Low, likely and high exposure per finding |
| 3. Report | Writes portfolio rollups and trends | Dashboard, trends and API views |
Estimates are recomputed after every scan.
Regulatory Exposure
When a finding touches regulated data, the engine applies the single strictest regulatory multiplier — they never stack — and adds an estimated regulatory fine. Regimes include GDPR, HIPAA, PCI DSS, SOX, CCPA, LGPD, APPI, PDPA, PIPEDA and POPIA.
Attack-Path Signals
The Attack Path engine writes signals onto each resource, and the Risk engine uses them to raise the likelihood side of the estimate:
- the finding is on an attack path
- the resource is on many attack paths
- the resource is a choke point
- an active threat actor is touching the resource — highest of all when it is an admin role
- a certificate on the resource is close to expiry
A large blast radius raises the estimate further. The estimate stays per finding — attack paths raise it; they are not priced on their own.
Output Metrics
Per finding:
- Low, likely and high exposure — a dollar range rather than a single point
- Primary loss and regulatory fine — shown separately
- Risk tier — critical, high, medium or low, from the likely exposure
- Blast radius — a sample of the resources reachable from it
Per portfolio:
- Total exposure — across all open critical and high findings
- Top scenarios — ranked by likely exposure
- Exposure by engine and by scenario type — data exfiltration, privilege escalation, credential theft, ransomware and others
- Risk trend — exposure over time
API
# Risk dashboard
GET /api/v1/risk/dashboard

# Scenarios, ranked by exposure
GET /api/v1/risk/scenarios

# Exposure over time
GET /api/v1/risk/trends

# Highest-risk assets
GET /api/v1/risk/assets/top
Full schemas are in the API reference.
FAQ
Can I calibrate the model with our own financial data? Yes. Per-record cost, annual revenue and the data-sensitivity multipliers can be set per tenant, overriding the industry defaults.
Does this replace a formal risk assessment? No. Onam Risk Quantification is automated estimation, designed to drive prioritization and board reporting. It does not replace a formal risk assessment carried out by a practitioner.
How often are estimates updated? After every scan.
Next steps
- Attack Path — the reachability and choke-point signals behind the boosts
- Vulnerability Management — the EPSS signal behind likelihood
- Data Security — the classification behind sensitivity
- Book a demo — see your estate's exposure in dollars