Where is the money going, and who owns it?
Onam FinOps turns reconciled billing data into what finance asks: what we spent, who owns it, what we will spend next and what we can stop — with the provenance of every figure on the page.
Stand-alone, granted per organisation · same console and login as the rest of Onam · read-only access to your cloud
- cost ingestion
- Dailycost ingestion
- cost, side by side
- Billed + effectivecost, side by side
- forecast range
- Low · expected · highforecast range
- on every saving
- Accept / dismisson every saving
The bill arrives every month. The explanation does not.
Cost went up eleven percent and nobody can say why before the next board meeting.
The provider console shows the total but attributes it by account, not by team. The tagging strategy covers about two thirds of resources, so a third of the bill belongs to nobody. Savings recommendations arrive as a list with no owner attached, so they are read, agreed with, and never actioned. Meanwhile the finance team is reconciling against an export that landed mid-close, and no one is sure whether this month's figure is final or still moving.
The cost of an unexplained bill
Spend nobody owns is spend nobody reduces. Without attribution and a settled number, every cost conversation starts with an argument about whose figure is right.
The cost stage of the Onam platform
Onam FinOps in two minutes
Voices are AI-generated. More short Q&A videos: Onam FinOps
5 modules, one product
The same modules as the Products menu. Each card opens its own page, with the documentation one click further.
Cost explorer
Daily cost, billed and effective, period over period
ExploreOwnership & attribution
Cost by owner and cost centre, with what is unattributed
ExploreForecast, budgets & anomalies
Forecast as low, expected and high; budgets; anomalies
ExploreSavings
Recommendations, each with a decision attached
ExploreReconciled billing
Whether each period is final — the provenance behind every figure
ExploreWhat each view of FinOps shows
Each view of Onam FinOps, described from the product documentation.
What moved, and where
The daily cost series and period-over-period movement.
- Daily cost, the granularity at which a spike has an answer
- Movement against the previous period, ranked by what contributed
- A flag on partial periods, so an early-month comparison is not read as final
Who owns the spend
Cost attributed to owners and cost centres by your ownership rules.
- Attribution coverage as a percentage
- The unattributed amount, stated beside it
- Ownership rules that map resources to owners and cost centres
What comes next
Forecast, budgets and anomalies — the forward-looking half of cost management.
- A forecast as low, expected and high, not a single line
- Budgets tracked against the forecast as well as actuals
- Anomalies detected on the daily series, not monthly totals
What you can stop spending
Cost-reduction recommendations, each with a decision attached.
- A portfolio upper bound, labelled as a bound rather than a projection
- Accept or dismiss on every recommendation, recorded
- Nothing changed in your account — accepting records the decision only
How settled the number is
The ingestion and reconciliation history behind every figure.
- Daily runs for the current period and a monthly-close run for finished ones
- Which periods are settled and quotable, and which are still moving
- Gaps in the run history, visible as gaps
Billed and effective, side by side
How billing data is reconciled and reported.
- Billed cost — what the provider invoiced
- Effective cost — commitments and amortised charges spread over the periods they cover
- Cost by category, owner, resource and day, checked so the parts add up to the whole
The mechanism, step by step
What Onam FinOps actually does, in the order it does it.
- 1Ingest
Billing data is ingested on a daily cadence with a separate monthly-close run, and each cost period reports both its billed cost and its effective cost so discounts and commitments are not silently flattened into one figure.
- 2Reconcile
Every ingestion run is recorded with its reconciliation state, so the console can tell you whether a period is settled or still moving instead of presenting a partial month as if it were final.
- 3Attribute
Ownership rules attribute cost to owners and cost centres, and the attribution coverage is reported as a number alongside the unattributed amount — the honest version of tag-based allocation, which is never complete.
- 4Decompose
Costs are decomposed by category, by owner, by resource and by day, with period-over-period movement so a change is traced to what moved rather than asserted.
- 5Forecast
Forecasting produces a low, expected and high figure rather than a single line, budgets are tracked against it, and anomalies are surfaced against the daily series.
- 6Decide
Savings recommendations carry a portfolio upper bound and an explicit accept-or-dismiss decision, so a recommendation has a state and a person rather than being a row on a list.
FinOps Agent
Onam AIOps agents investigate with evidence on every claim and propose changes a person approves. Nothing changes your cloud without that approval.
Specific outputs, not a dashboard of promises
- Billed cost and effective cost per period, with the difference visible rather than flattened
- Reconciliation status on every period
is this month settled, or still moving
- Cost by category, by owner, by resource and by day
- Period-over-period movement analysis
what actually changed, not just that it changed
- Attribution coverage percentage and the unattributed amount, stated plainly
- Ownership rules that map cost to owners and cost centres
- Forecast with low, expected and high bounds instead of a single false-precision line
- Budget tracking and anomaly detection against the daily cost series
- Savings recommendations with a portfolio upper bound and an accept or dismiss decision
- Ingestion and reconciliation run history, so the provenance of every figure is on the page
What Onam FinOps does not do
Knowing where a product stops is part of deciding whether to buy it.
It does not act on a saving
Accepting a recommendation records the decision. FinOps does not resize, stop or delete anything in your account.
It does not move money
Showback and chargeback statements say what each owner and cost centre is responsible for. FinOps does not move money between ledgers or issue internal invoices — your finance process does that.
Attribution is only as complete as your rules
Coverage is reported as a percentage with the unattributed amount beside it, rather than implied to be complete.
The current period is an estimate until it closes
Daily figures move until the monthly-close run. New accounts need some daily history before anomaly detection is useful.
Onam FinOps on one page
Inputs, how it works, what you get and the limits — the same sheet our team uses in briefings.
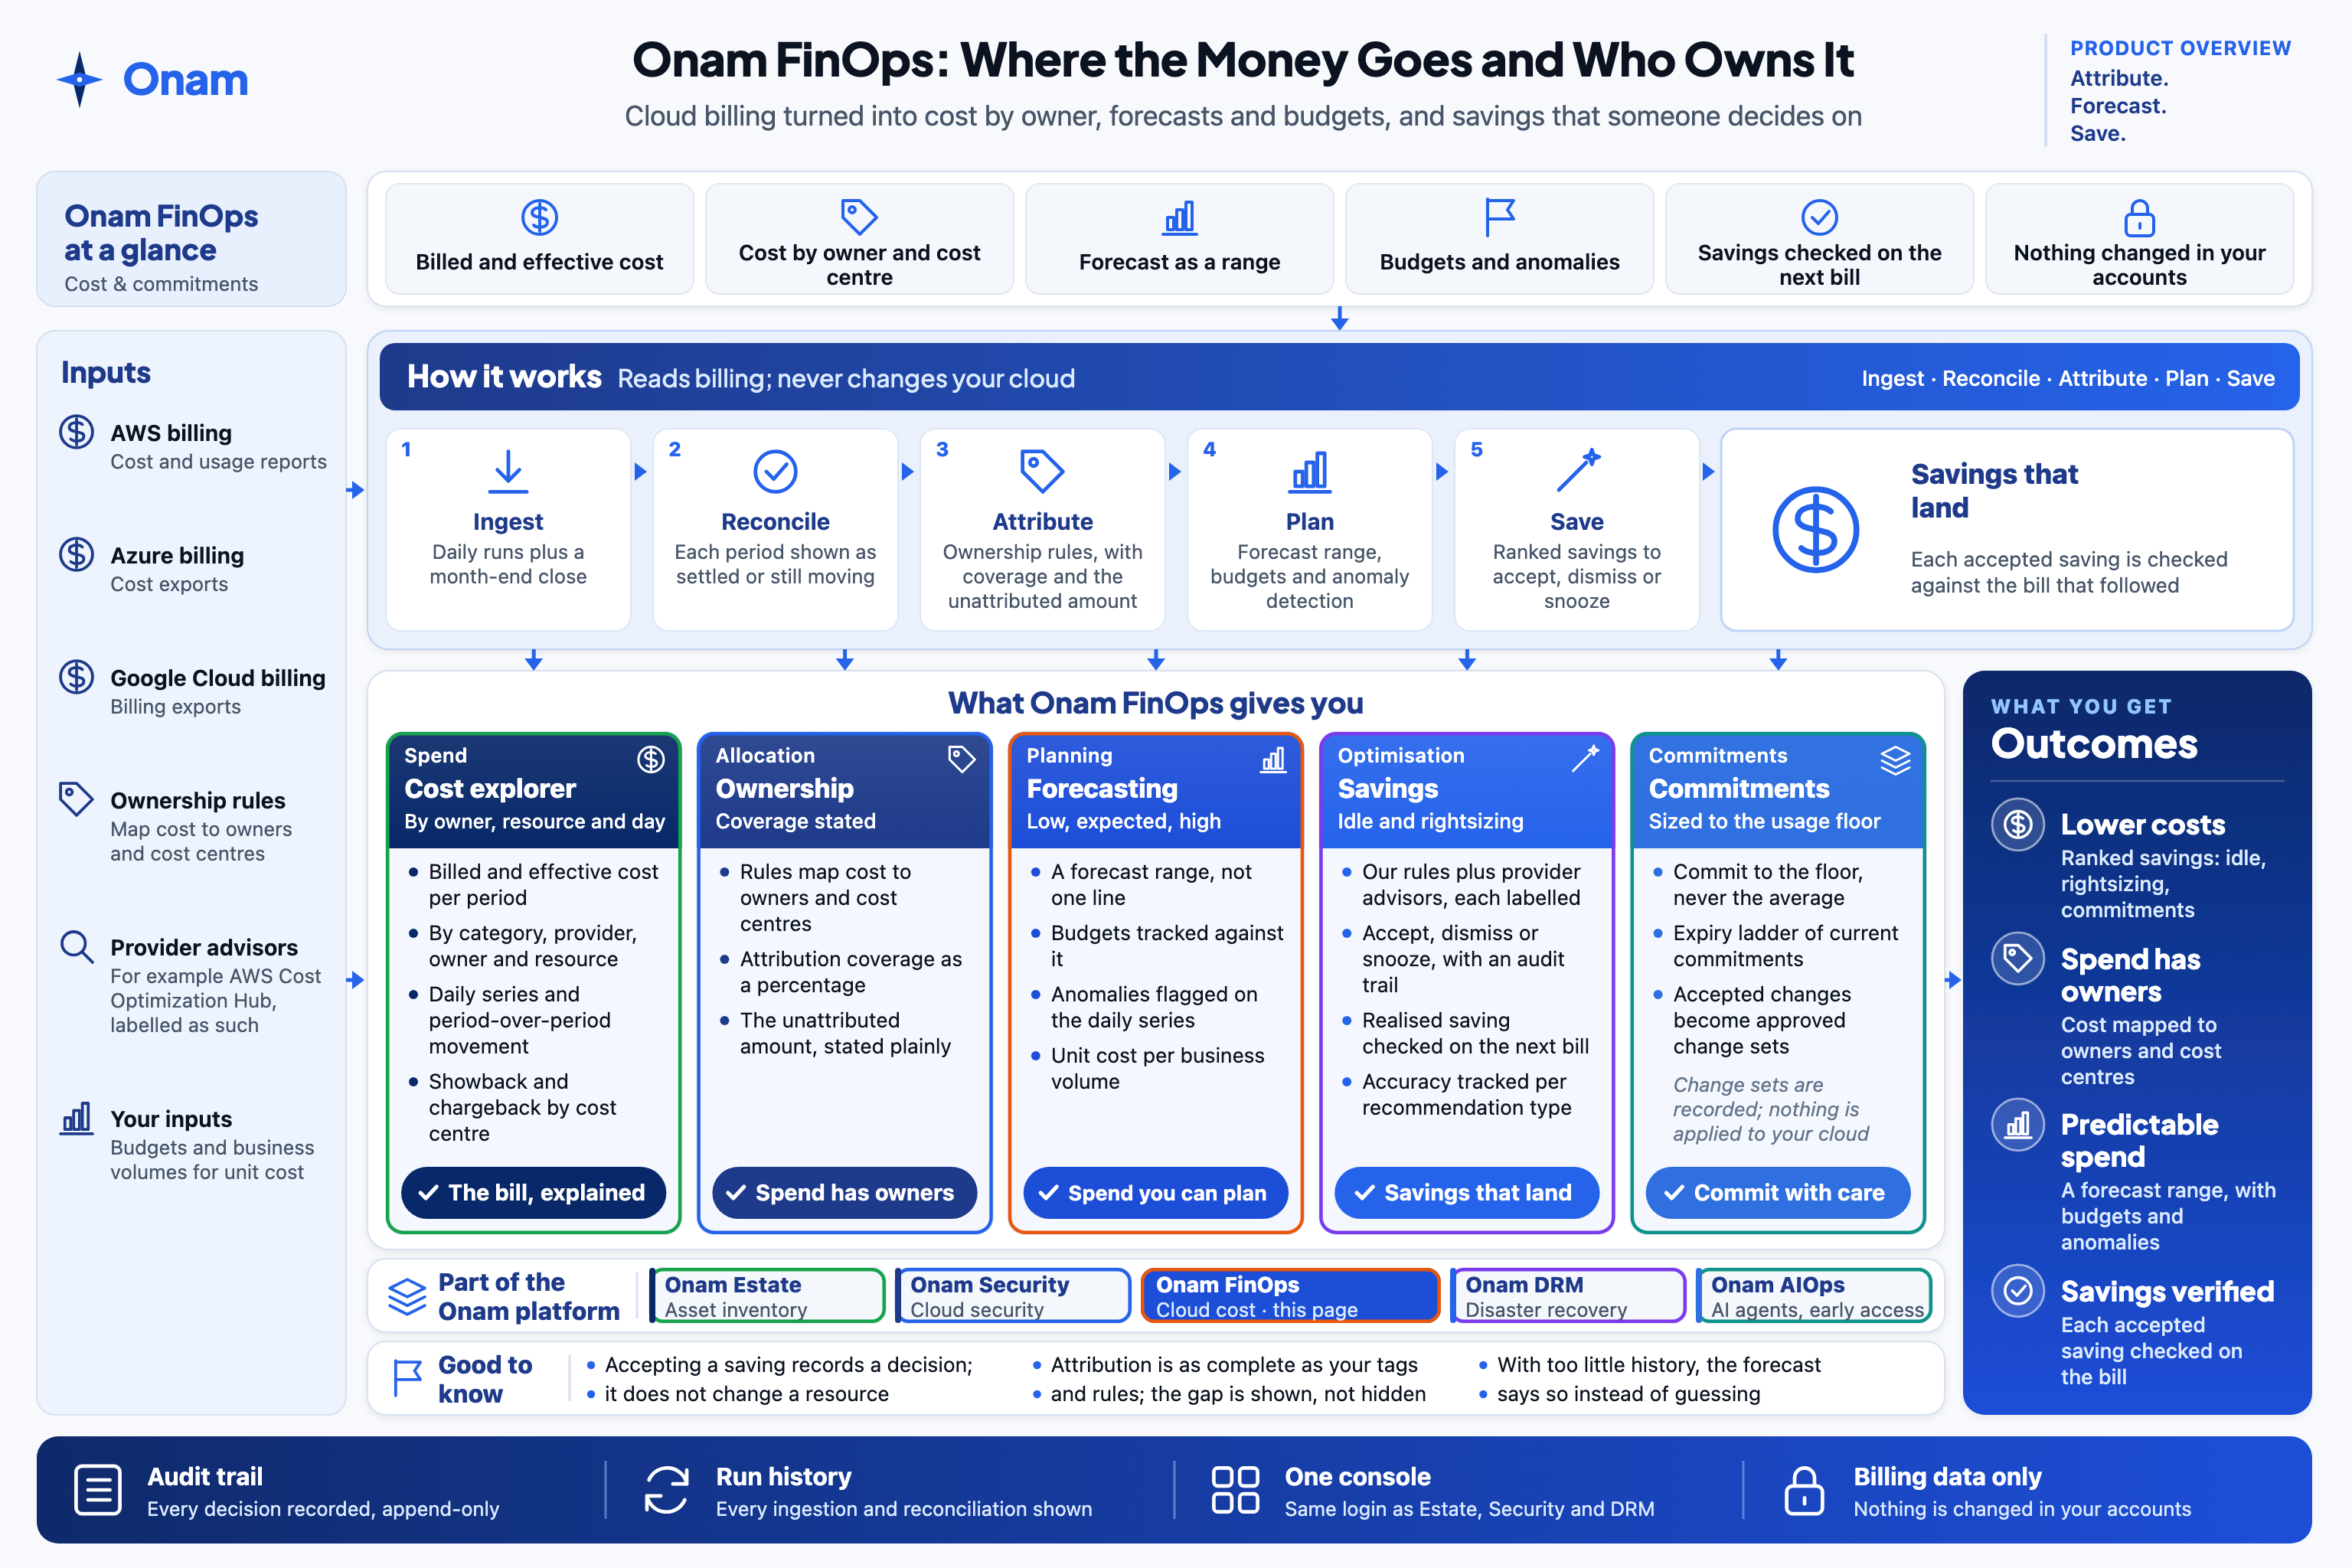 Open full size
Questions about Onam FinOps
Onam FinOps is one part of one platform.
Estate finds what you run, Security protects it, FinOps explains what it costs and DRM plans how it comes back — with Onam AIOps agents across them, on the same discovery.
What do we actually run, and how is it wired together?
Is my cloud secure, and what do I fix first?
Where is the money going, and who owns it?
If a region fails tonight, what comes back, in what order, and how fast?

Can AI agents do the investigation — and leave every change to a person?
See Onam FinOps on your billing data.
FinOps reads billing data and changes nothing in your accounts. It runs in the same console as Estate, Security and DRM.