The code passed static analysis.
Then the app went behind a load balancer that strips the HSTS header, a debug setting left stack traces switched on in staging, and an older endpoint still takes a URL parameter and fetches it server-side. None of that is visible in the repository. It is only visible to something that talks to the running app the way an attacker would.
What the code review cannot see
Static analysis reads the code you wrote. It does not see the reverse proxy that drops a security header, the framework default that leaks a stack trace, or the endpoint nobody documented.
The mechanism, not the marketing
- 1
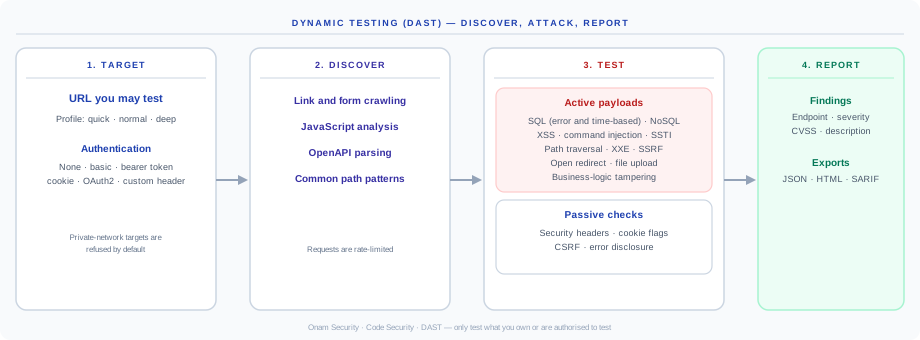
You give a target URL you are authorised to test, a scan profile (quick, normal or deep) and, if the app needs it, authentication: basic, bearer token, cookie, OAuth2 or a custom header. Targets on private networks are refused unless that is explicitly enabled.
- 2
Discovery builds an endpoint inventory from link and form crawling, JavaScript analysis, an OpenAPI description if the app publishes one, and common path patterns. All requests are rate-limited.
- 3
Active tests send payloads for SQL injection (error-based and time-based blind), NoSQL injection, cross-site scripting, command injection, server-side template injection, path traversal, XXE, SSRF, open redirect, file upload and business-logic tampering.
- 4
Passive checks look at every response for missing or weak security headers, cookie flags, CSRF protection and error messages that disclose internals.
- 5
Findings are stored with the endpoint, severity, CVSS and description, shown on the DAST tab and scan page, and can be exported as JSON, HTML or SARIF. A DAST scan starts from the console when you add a target URL to a new scan, or through the API.
Specific outputs, measurable outcomes
How Dynamic Testing (DAST) fits together
Questions we get a lot
Ready to see Dynamic Testing (DAST) on your app?
Give us a staging URL you are authorised to test. We will run a scan with you and go through what it found.